Tracing for modern web applications.
Search for and query the traces across your full-stack web app. Get started in seconds.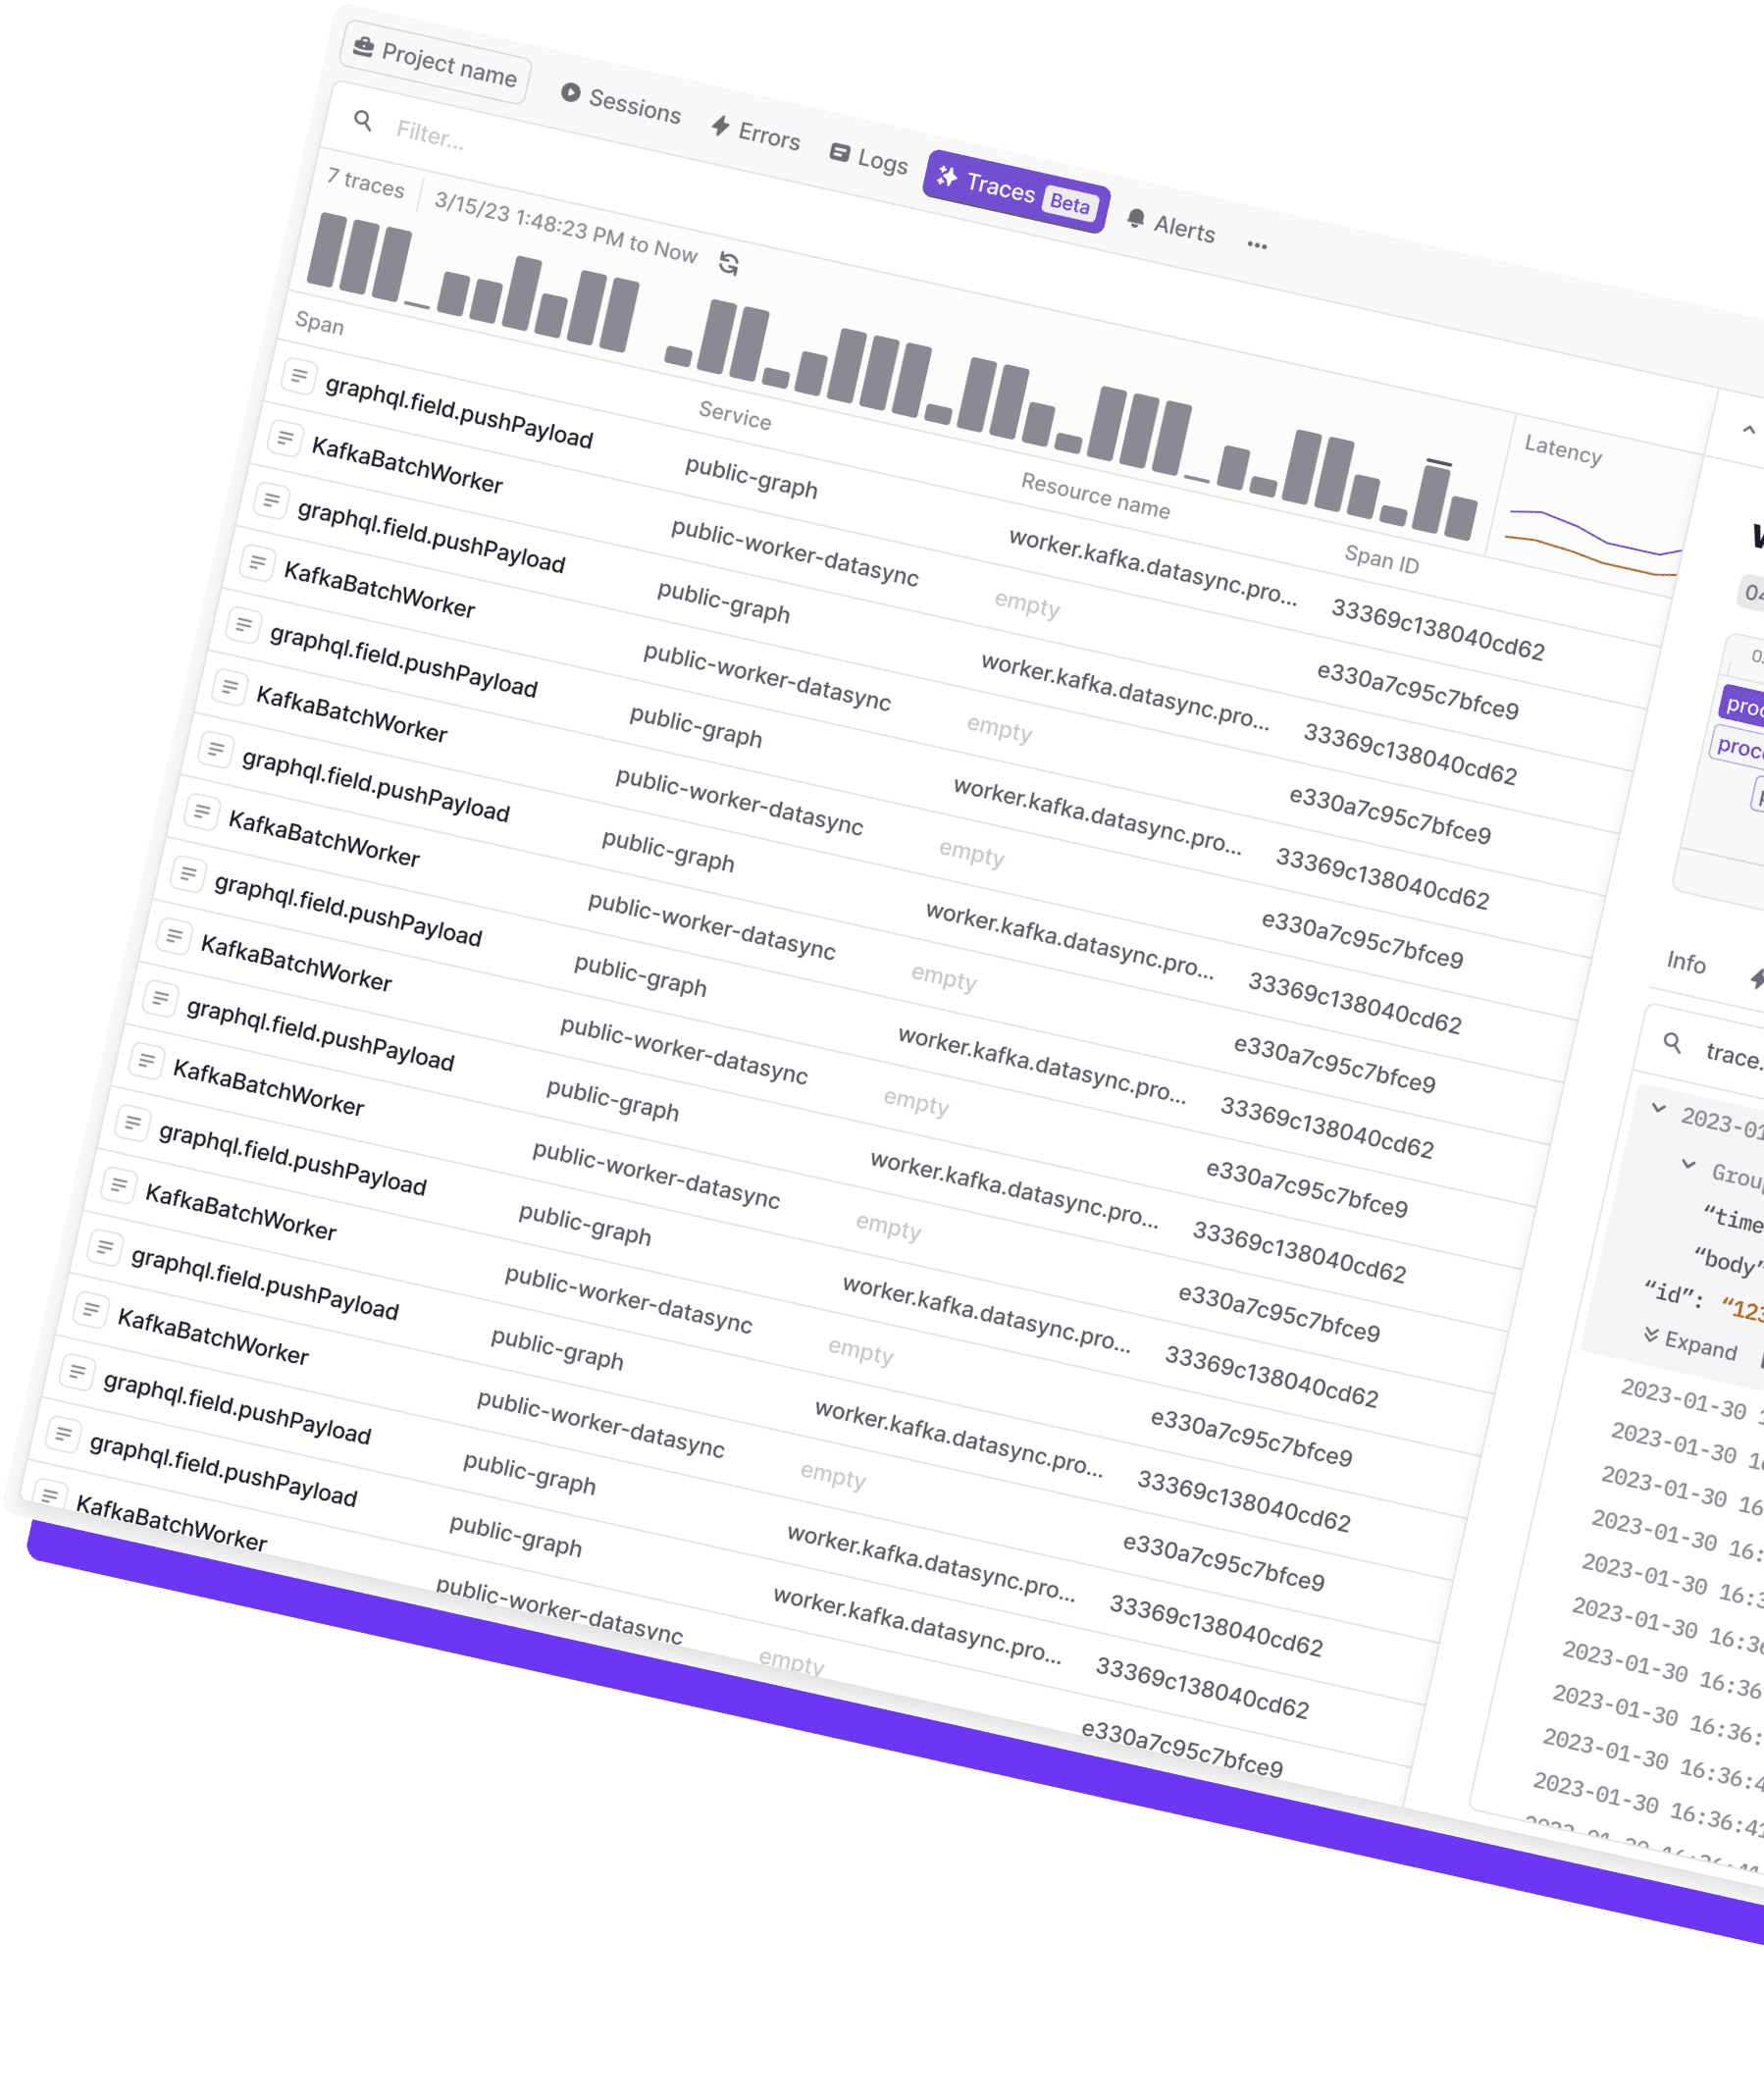


Measure performance across your application.
Pinpoint latency across your entire codebase, all the way from the client to server.
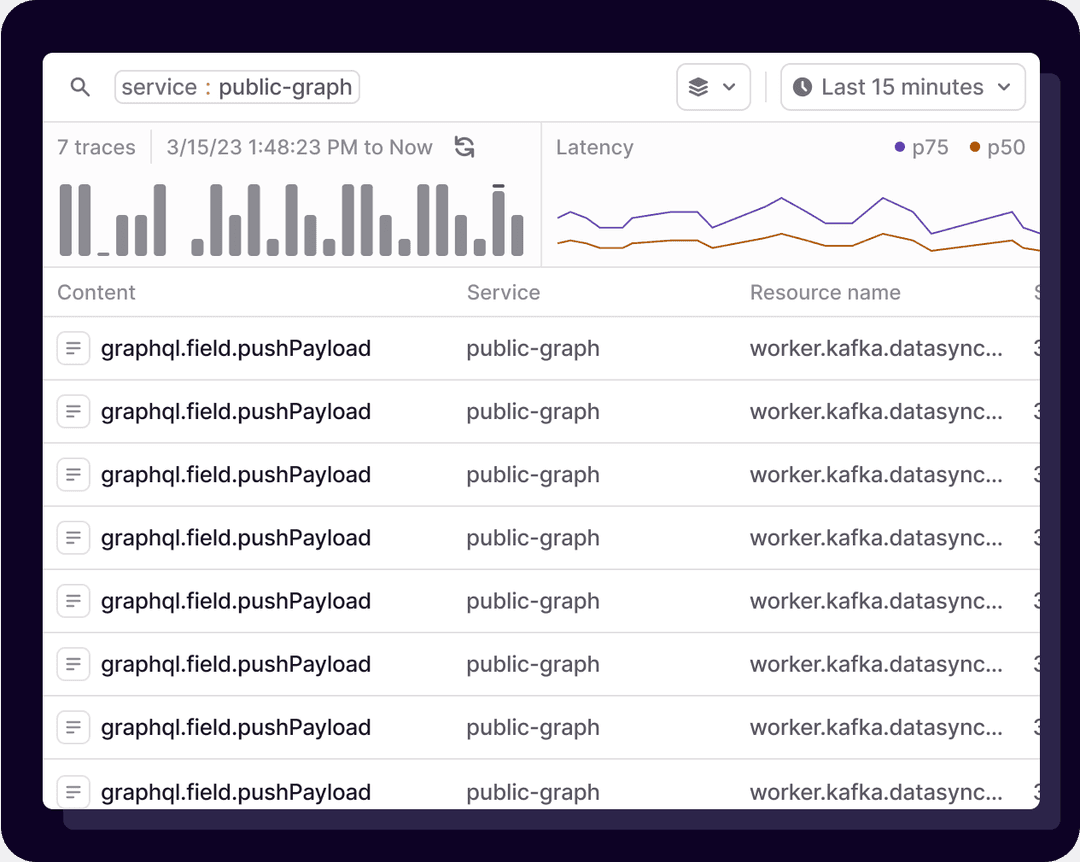
Dig deep into nested code execution.
Scrutinize every layer of your codebase and identify bottlenecks, inefficiencies, and areas of optimization.
Powerful search. Powered by ClickHouse.
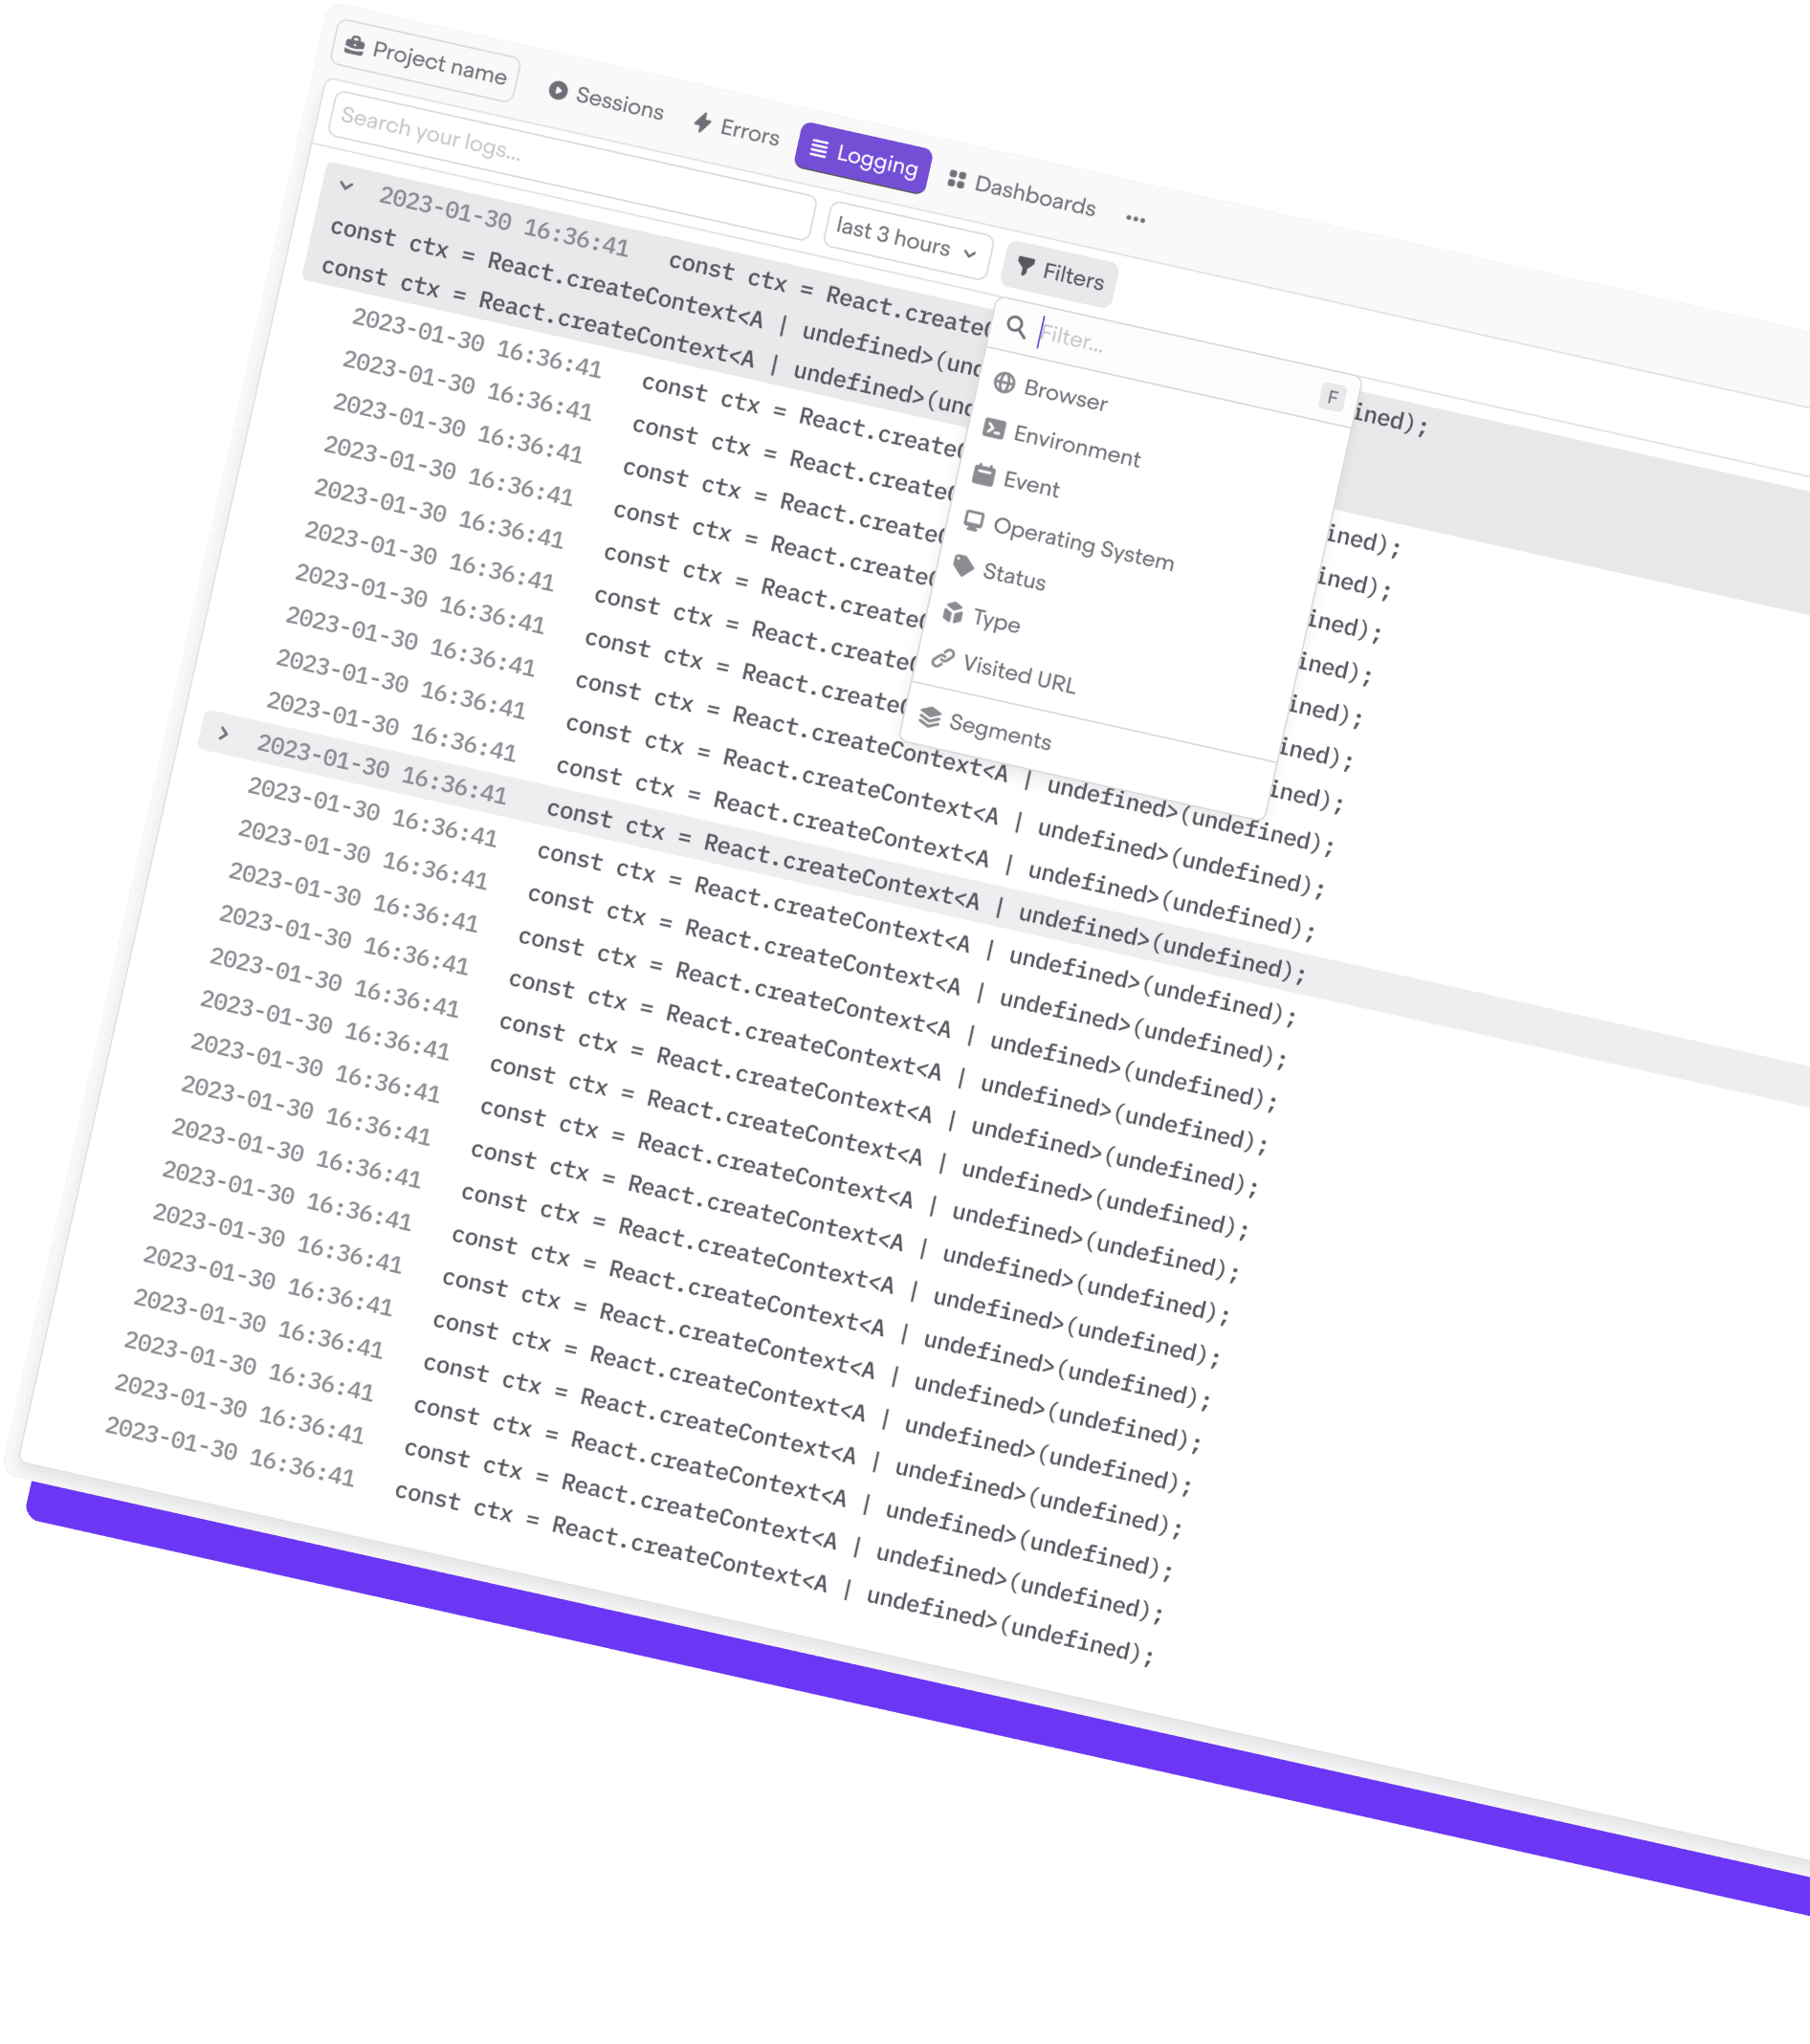
Perform fine-grained searches across all of your traces. Powered by ClickHouse, an industry leading time-series database.
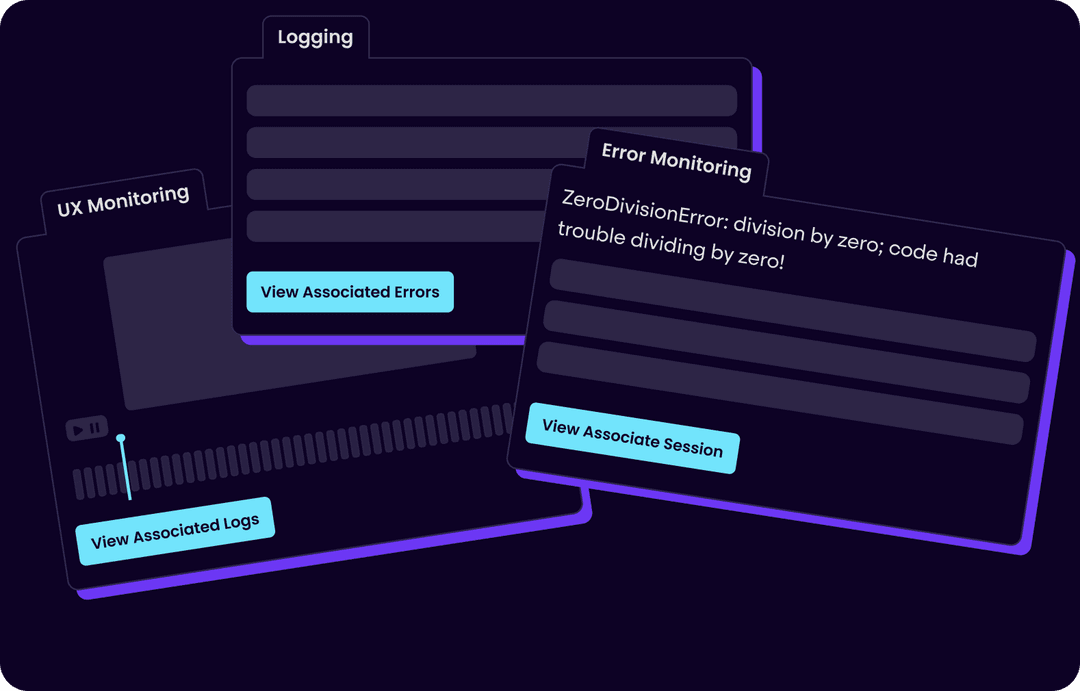
From a “click” to a server-side trace.
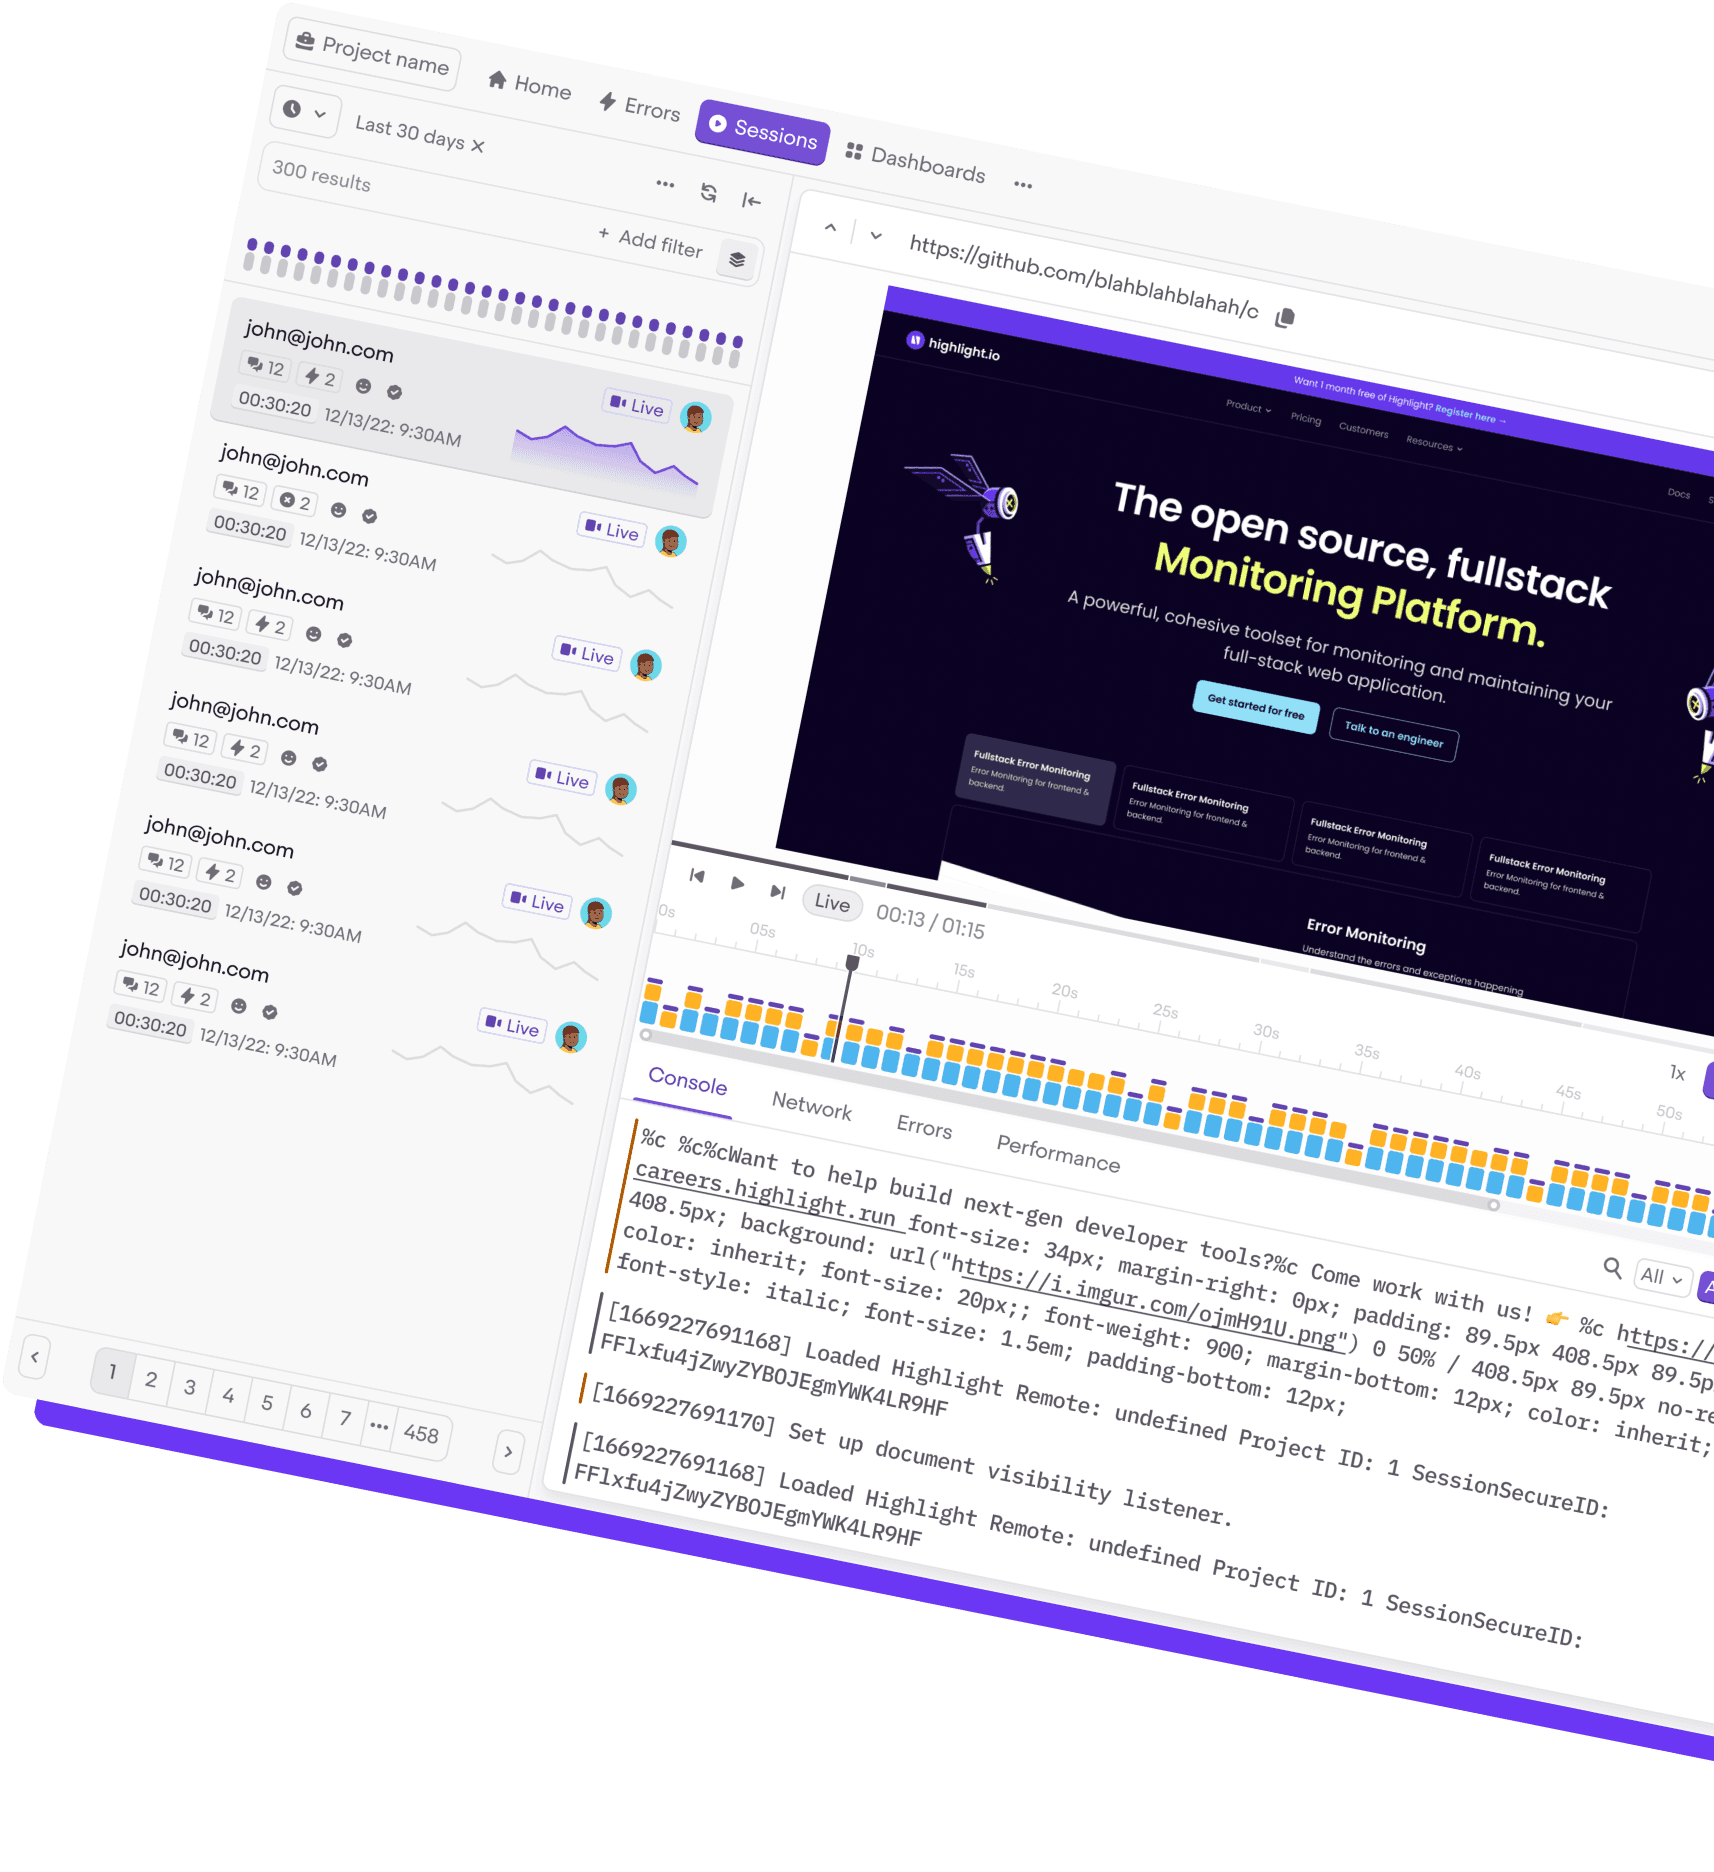
Visualize a complete, cohesive view of your entire stack. All the way from a user clicking a button to a server-side trace.
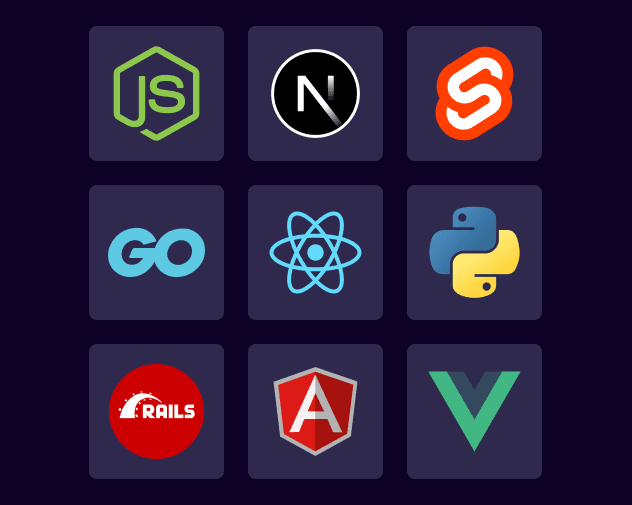
Support for all the modern frameworks.
Whether its Python, Golang, or even vanilla JS, we got you covered. Get started with just a few lines of code.
H.init("<YOUR_PROJECT_ID>", {
	tracingOrigins: ['localhost', 'example.myapp.com/backend'],
    ...
});
A few lines of code. That’s it.
Install highlight.io in seconds and get tracing out of the box.
Join our Observability in Next.js livestream.
If you’re curious about Evaluating LLMs in Production , join us on Tuesday, July 2nd at 1pm PDT for a full walkthrough.
Our customers
Highlight powers forward-thinking companies. More about our customers →Don't take our word. Read our customer review section →
Try Highlight Today
